Manual Scaling
Sometimes you will want better control over the temperature and humidity scale, or the time window in which readings are displayed, than you can achieve with the mouse zoom.
To do that, you can enter the zoom values directly:
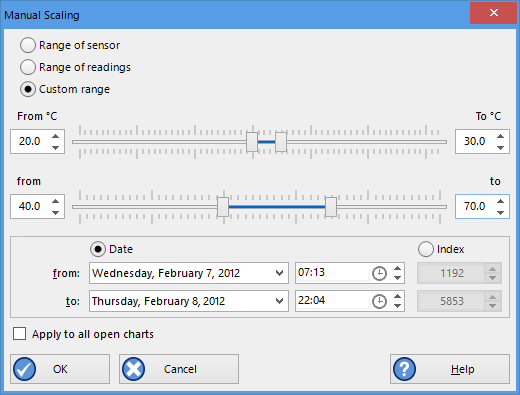
Right-click anywhere on the chart area and select Manual Scaling. The dialogue as shown will be displayed.

Manual scaling window
You can select:
- Range of sensor; the chart is zoomed to the minimum and maximum values for each sensor. These values are dependent on the logger model.
- Range of readings; the chart is zoomed so the axis covers the minimum and maximum reading values (with a small margin added).
-
Custom Range
When selecting this option you have complete control over which part of the graph is displayed.
You can specify
- The temperature (and humidity ranges if applicable) for the y-axis.
- the date and time range for which the readings will be shown. Please note that you cannot enter dates and times outside the span of the logger's logged data.
- Alternatively you can specify an index range for the readings. You can see each reading's index in the data tab. This is useful if you wish to display a certain part of multiple files that do not cover the same date and time range.
Initially the dialog shows the current zoom settings.
If you select the check box Apply to all open charts, these settings will be applied to all currently open charts as follows:
-
The Y-axis scaling (temperature and humidity) will be applied to every open chart. Range of sensor and Range of readings use the currently active chart's sensor range or reading range for all charts. If you want each chart to display its own sensor or reading range, please select the corresponding option in Default Zoom in the chart options.
-
The X-axis scaling (time) will be applied to every chart with readings inside the selected time frame, including pre-start readings.
If a chart's readings fall completely inside the specified range, the X-axis will not be scaled.
If a chart's readings fall partially inside the specified range, the X-axis will be scaled so only those readings inside the range will be displayed.
A chart will always display the readings at the time they were recorded. As a result the first and last readings may not always align perfectly with the selected time frame, particularly with long log intervals.
-
No scaling will be applied to files where the active tab is the summary tab, day summary tab or one of the data list tabs.
The zoom range is also not applied to TIC20 and TICT indicator products.
If you clear the check box Apply to all open charts, the chosen settings will only be applied to the currently active chart.
Click to apply your selected settings, or to abort.
To return to the previous zoom level, click Zoom Out from the Edit menu, click ![]() on the toolbar or right-click anywhere on the graph area and select Zoom out. You can do this individually for each chart. You can also right-click and select Zoom Readings.
on the toolbar or right-click anywhere on the graph area and select Zoom out. You can do this individually for each chart. You can also right-click and select Zoom Readings.