Chart Statistics
This window allows you to specify which statistics are displayed on the chart tab.
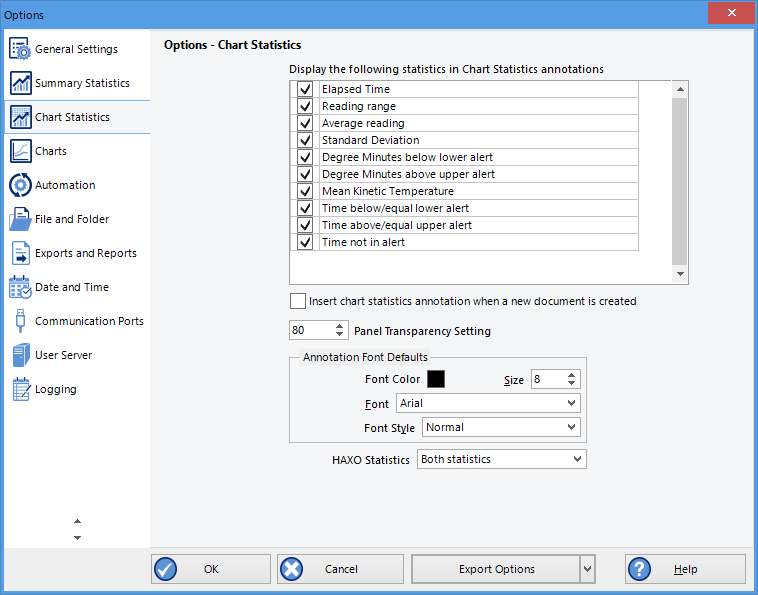
Chart Statistics Options dialogue
Display the following statistics in Chart Statistics annotations
Select all options you wish to be shown, and clear all options you wish to hide.
Insert chart statistics annotation when a new document is created
Select this if you wish to include the statistics you selected automatically when a new chart is generated. Initially the box will be placed in the upper left corner of the chart, but you can drag it to a different location if desired.
Clear this box if you want to do this manually for each chart.
Panel Transparency Setting
Set the level of transparency for the chart statistics box. The lower this value, the more transparent the box will be, so you can see the chart behind the box, and vice versa.
Annotation font defaults
This group of settings determines the default look for the font used in annotations. You can set the font, size, style and colour. you can later change these parameters in the annotation panel.
HAXO-8 statistics
Here you can set if you wish to insert only the statistics for temperature, only the statistics for humidity, or both when you download or open HAXO-8 logger data.