Viewing the Recorded Data
When you have found the recorders for which you want to view the data, you can either
- view the data for a single recorder by clicking its serial number
- view the data for multiple recorders by selecting multiple rows and clicking View Multichart.
Single Chart View
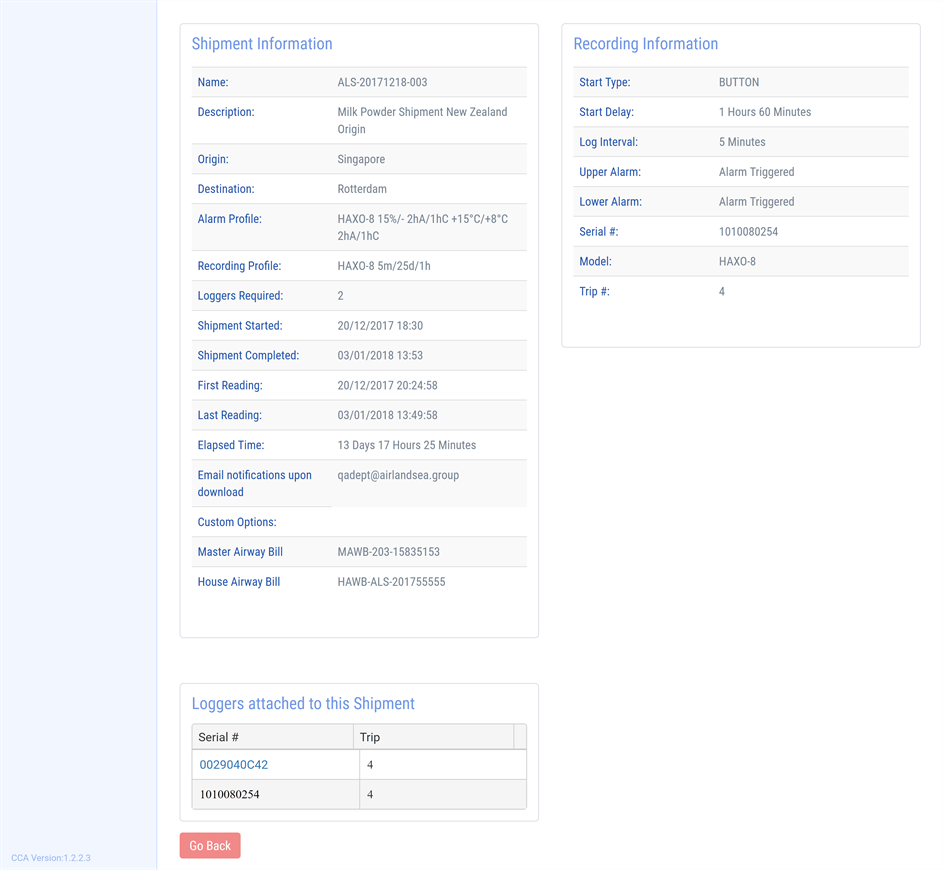
When you view data from a single recorder the Analyze Shipment page opens. Here, you will see a chart as well as various separate sections with detailed information about temperature, humidity (where applicable), shipment details, recording details and a list of recorders that are attached to this shipment.
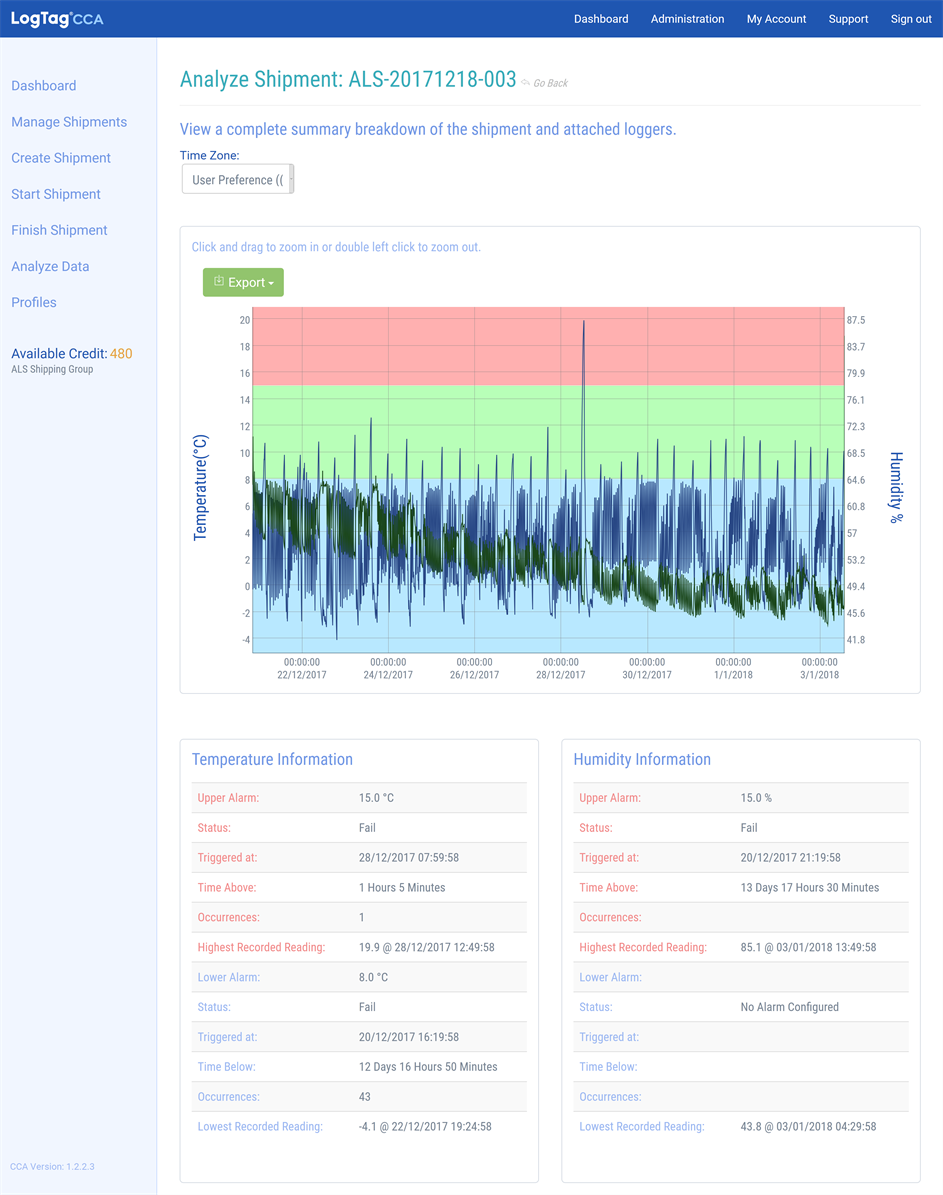
Viewing the recorded data and shipment summary
The report does not contain a data listing. You can, however, see the exact temperature or humidity value recorded at a specific time by hovering the mouse cursor over the graph. A single data point will be highlighted and an inset window will show the time and temperature value of the data point.
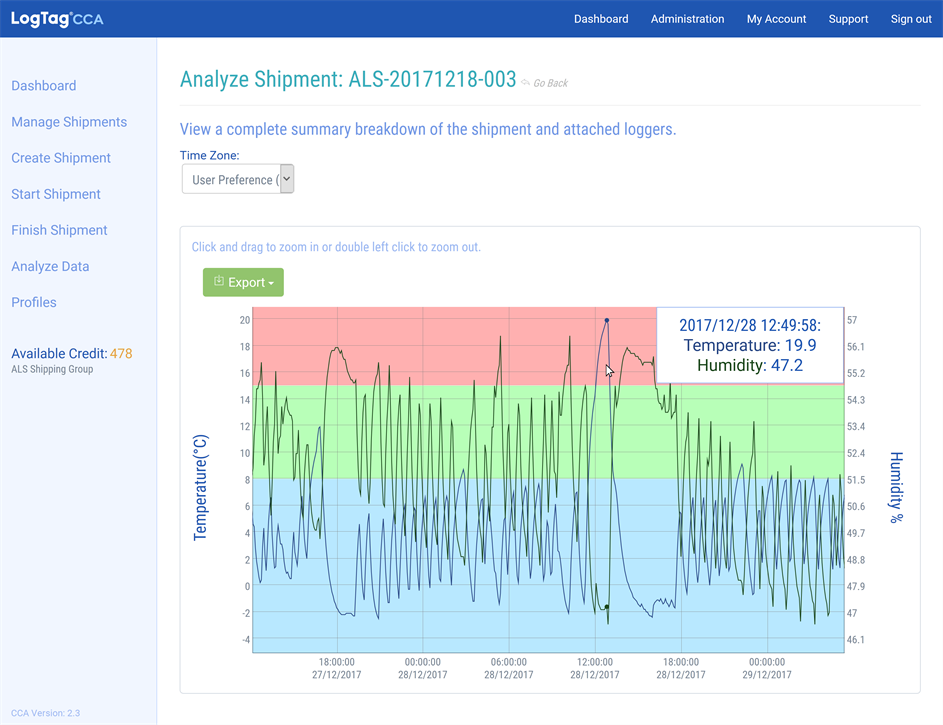
Viewing individual data points
The chart background is coloured, matching the alarm conditions configured for the shipment. A blue background shows the area below the lower alarm threshold, red is the area above the upper alarm threshold and green is the area in between.
Zooming the chart
You can zoom the chart to see the recorded data in more detail.
To see a shorter time period, click and drag the mouse horizontally over the area you are interested in. The chart is zoomed to the area you highlight.

To see temperature or humidity more accurately, click and drag the mouse vertically over the area you are interested in. The chart is zoomed again to the area you highlight.

To zoom out, double click anywhere in the chart area.
Times and Dates
Initially, the times displayed are relative to the time zone the user has set in the My Account preferences. You can select a different time zone to view the data from the Time Zone list.
Ronald de Leeuw is a Receiver for the Rotterdam branch. He can select viewing the data in the following time zones:
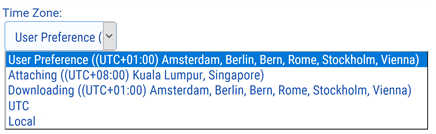
In his case, viewing the data in the User preference, Downloading or Local time zones will all render the same result, as his local time zone is the same time zone the recorders were downloaded in.
If he wants to discuss the results with Davinder from the Singapore branch, they can both switch to the same time zone.
Exporting the Data
You can export the recorded temperature and humidity data for further analysis. Click Export to save the data locally in two different formats:
- in CSV format for importing into a spreadsheet
- in LTD format, which is the LogTag® Analyzer proprietary data format. These files can be opened with LogTag® Analyzer.
Multi Chart View
When you have selected multiple recorders to view, the Multi Chart page will open:

Displaying an aligned multi chart
The same controls apply as for the single chart, except the backgroud is not coloured, as different recorders may have different alarm thresholds.
Initially, the charts open as an aligned multi chart. The first data points of each individual chart are aligned at time marker zero, regardless of the time the recorder was actually started. The chart shows elapsed time, which makes it easier to compare recorders from different trips.

Displaying a standard multi chart
You can select multi chart if you want each reading of each recorder to be shown at the time it was taken. The chart shows real time, which makes it easier to view a time line.