Chart annotations
You can include additional information in your chart tab by adding textual and graphical annotations. Annotations are stored in the *.ltdx file and will be shown again when you next view the file. Annotations will be printed, and will also be shown on anyone else's computer, if you are sharing annotated files. You can place up to 58 individual annotations.

Chart Right-Click Menu

Chart Annotation Panel
If a chart's annotations are currently shown, you can hide them by right-clicking anywhere on the chart and clearing the tick for Show Annotations. You can show them again by selecting Show Annotations. You can also perform both actions via the Chart Control Panel.
Adding Annotations
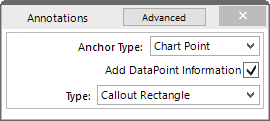
To start annotating charts, right-click anywhere on the chart and select Annotate Chart from the menu. This will open the basic view of the Annotations Panel.
You can also open this by clicking Annotate Chart from the Chart Control Panel.
When the Annotations Panel is open, an annotation will be placed at the position of the mouse pointer every time you click the mouse button on the chart canvas. You can choose different types of annotations with different behaviour. The following table explains what each of the options in the Annotations Panel mean and how they influence the look and position of the annotation:
| Option | Selection | What it does |
|---|---|---|
|
Anchor type |
Chart Point |
If a Chart Point annotation is placed, the annotation will always be linked to the time stamp of the reading on which the mouse pointer is positioned when placing the annotation. If the chart is zoomed or panned, and the data point is not visible, the annotation is also not shown. When a chart becomes part of a multi-Chart, all Chart Point annotations for the single chart are also visible in the multi-chart. Chart Point Annotations are good for marking specific times on the chart with additional information. |
|
Background |
If a Background annotation is placed, the annotation will always be linked to the position on the canvas in which it was placed. Even if the chart is zoomed or panned, the annotation will always stay in the relative position from the canvas edges. Background annotations are good for placing information relating to the entire chart. The Statistics Information for example is placed on the canvas using a background annotation. |
|
|
Add DataPoint Information |
Enabled Disabled |
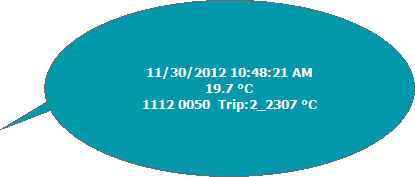
This option can only be selected when the Anchor type is Chart Point. If enabled, text will automatically be added to a callout, showing date, time, value and type of reading. If disabled, the callout will be empty. |
|
Add Series Information |
Enabled Disabled |
This option can only be selected when the Anchor type is Background. If enabled, text will automatically be added to a callout, showing the charts series information from the legend. If disabled, the callout will be empty. |
|
Type |
Callout Rectangle |
|
|
Callout Ellipse |
|
|
|
Line |
|
|
|
|
Arrow |
|
|
|
Rectangle |
|
|
|
This annotation is only available as a Background annotation. When it is selected from the drop down, a rectangular callout is placed on drawing canvas, and text will automatically be added to the callout, showing the information defined in Chart Statistics, for example range of readings or min/max/average values.
Tip: If you wish to place a rectangle with text inside, place a Chart Statistic Annotation
and replace the text with your own. |
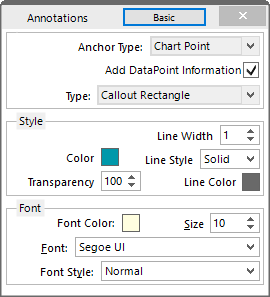
You can refine the appearance of annotations in the advanced view of the Annotations Panel. This view can be activated by clicking the Advanced button when the Annotations Panel's basic view is shown.

Advanced View of the Annotations Panel
You can click Basic to return to the basic view. If you close the Annotations Panel while in advanced view, next time you open it, it will also show the advanced view.
You will be familiar with these options from many other Windows programs:
| Group | Selection | What it does |
|---|---|---|
|
Style |
Line width
|
These parameters define the look of the shape object that is placed with every annotation. Line width, style and colour define the outline of the object, colour determines the object's fill colour and transparency defines how opaque or transparent the object will be. 100 is equal to the object being fully opaque, 0 to the object being fully transparent.
|
|
Font |
Font Colour |
These parameters define the properties of the font used for text inside the callouts. Note that only a small selection of system fonts is available.
|
Note: Mouse zooming and panning is disabled when making annotations.
You can, however, still use manual scaling to zoom to the desired section of the chart.
To stop annotating the file, close the Annotations Panel; right-click anywhere on the chart and select Annotate Chart from the menu. You can also close it by clicking Annotate Chart from the Chart Control Panel or by clicking the Annotations Panel's Close button . If you change file window tabs, the Annotations Panel closes automatically.

Chart with different types of annotations
Editing Annotations
To change the position of an annotation, use the mouse and point to the annotation. When the pointer has changed to  , press and hold the mouse button, move the annotation to the desired location and release the button.
To change the size of an annotation, click inside the annotation. The sizing handles appear. Use the mouse and point to one of the handles until the cursor changes ( ,
,  ,
,  ,
,  or
or  ). Press and hold the mouse button and drag the handle to the desired size.
To edit the text of an annotation, double click the annotation.
Deleting Annotations
To delete an annotation, click inside the annotation and press the Delete key. You can also right-click inside the annotation and click Delete Annotation.
 When this annotation type is selected, a rectangular callout shape is used when placing the annotation. If the
  When this annotation type is selected, an elliptical callout shape is used when placing the annotation. If the
  When this annotation type is selected, you can place a line on the drawing canvas:
 When this annotation type is selected from the drop down, you place an arrow on the drawing canvas:
 When this annotation type is selected from the drop down, a rectangular shape is placed on the drawing canvas. This rectangular area is useful for highlighting sections of the chart, but please note that you cannot place text inside this shape.