The Chart Control Panel
The chart control panel provides you with an easy way to turn elements of the chart on or off, to annotate the chart and to manipulate which part of the data is being displayed.
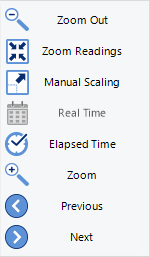
The upper part of the chart control panel contains some of the functions you can also find on the toolbar. These are replicated here to give you easy, convenient access in one location. These include scaling functions, time axis and inspection mark zoom.

Upper Chart Control Panel
The lower part of the Chart Control Panel controls what additional information is displayed on the chart. The default values for the various grid lines, markers and shadings are set in Edit - Options - Charts.
The options you set in the chart control panel are stored with the chart, provided you save the file after you have made the changes in the chart.
At a later stage, if you wish to return to the default settings you can click Reset do defaults.
You may also receive charts from other users with settings different to your own. These charts can also be reset to default values using this method.
|
Feature |
What this feature does |
|---|---|
|
Align charts |
Shifts all charts so their first readings align on the canvas. Please see Aligning Charts for more information. |
|
Reset do defaults |
Changes the appearance and position of all charts so they correspond with the settings made in Edit - Options - Charts. |
|
Annotate chart |
Opens the Annotation Panel and allows you to annotate the chart. Please see Chart annotations for further details. |
|
Show annotations |
Select, if you wish to show the chart's annotations, clear, if you wish to hide them. |
|
Inspection Marks |
Select, if you wish to show each recorded Inspection Mark in the chart, clear, if you wish to hide them. This setting also controls the Min/Max Reset Marks. |
|
Reading Marks |
Select, if you wish to show the chart's Reading Marks, clear if you wish to hide them. |
|
Download Marks |
Select, if you wish to show each recorded Download Mark in the chart, clear, if you wish to hide them. |
|
Paused Marks |
Selec,t if you wish to show each recorded Paused Mark in the chart, clear, if you wish to hide them. |
|
X-Axis Grids |
Select, if you wish to show the X-Axis (vertical) grid lines, clear, if you wish to hide them. |
|
Y-Axis Grids |
Select, if you wish to show the Y-Axis (horizontal) grid lines, clear, if you wish to hide them. |
|
Show only validated |
Select, if you wish to show only validated readings on the chart, clear, if you wish to hide them. Please see How secure is my data for further information about non-validated readings. |
|
(single-chart only) |
Select, if you wish to show readings above the upper alarm limit with a different background colour, clear, if not.
Loggers with more than 2 alarms may show more than one background colour. Please note these cannot be turned off individually.
|
|
Non Alert Shade (single-chart only) |
Select, if you wish to show readings in the non-alert area with a different background colour, clear, if they should appear with a white background. |
|
Below Alert Shade (single-chart only) |
Select if you wish to show readings below the lower alarm limit with a different background colour, clear, if not. |
|
Temp alert range/ (HAXO-8 single-chart only) |
If the button shows Temp alert range, the alert shading uses the temperature maximum and minimum alert values for the shading. If the button shows Hum alert range, the alert shading uses the humidity maximum and minimum alert values for the shading. The Y-Axis gridlines also adjust so they align with the corresponding divisions. |
|
Hide/Show (/ |
Clicking hides the Chart Control Panel when it is currently shown, clicking |
 )
)