Multi-Charts (Combining Charts into a Single View)
You can overlay data from multiple loggers in one view. When you click ![]() in the toolbar, all file window tabs containing data for a single logger are combined into one window, where you can access a Multi-Chart and a Multi-Report by clicking the corresponding tab.
in the toolbar, all file window tabs containing data for a single logger are combined into one window, where you can access a Multi-Chart and a Multi-Report by clicking the corresponding tab.

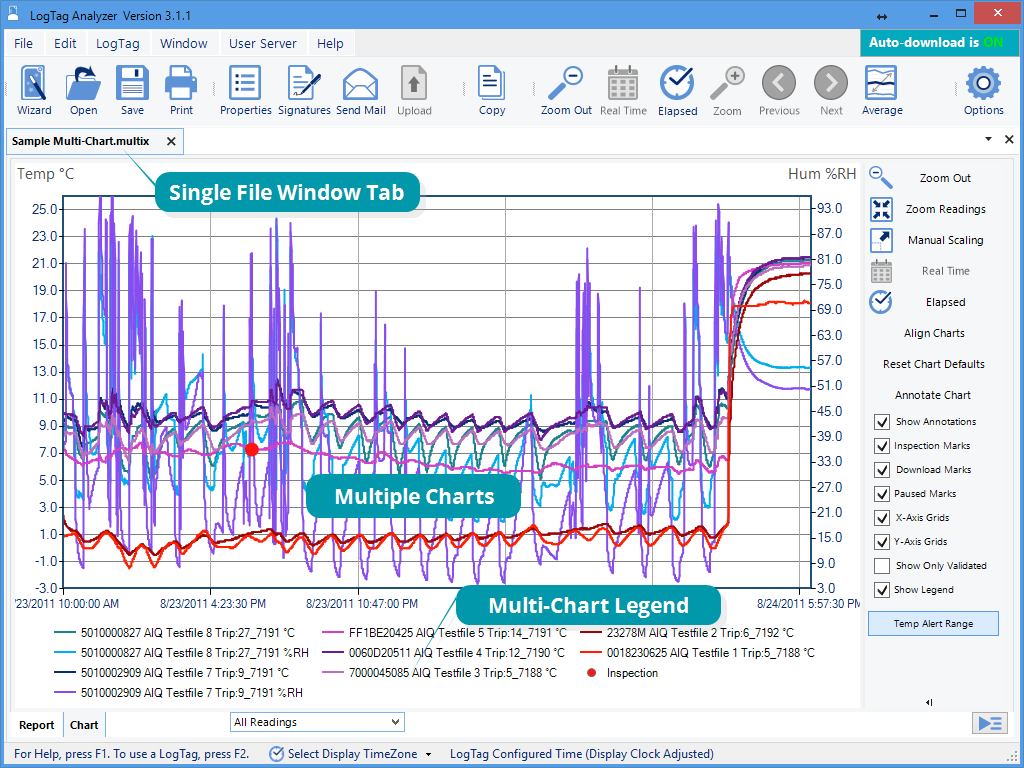
Seven charts combined into a multi-chart
Charts will be shown in different colours, as chosen in the colour palette in the Options for Charts, where you also define the composition of the Chart Legend. The legend contains an entry for each chart showing the chart's colour and the description defined in the settings.
You can annotate a Multi-Chart in the same way you annotate a single chart.
You can also view Min, Max and Average Charts, and select other options.
When you close a newly created Mutli-Chart, it will either be stored automatically, or you will be asked if you want to store the chart. This depends on the settings made in File and Folder Settings.
Hiding and Showing Charts
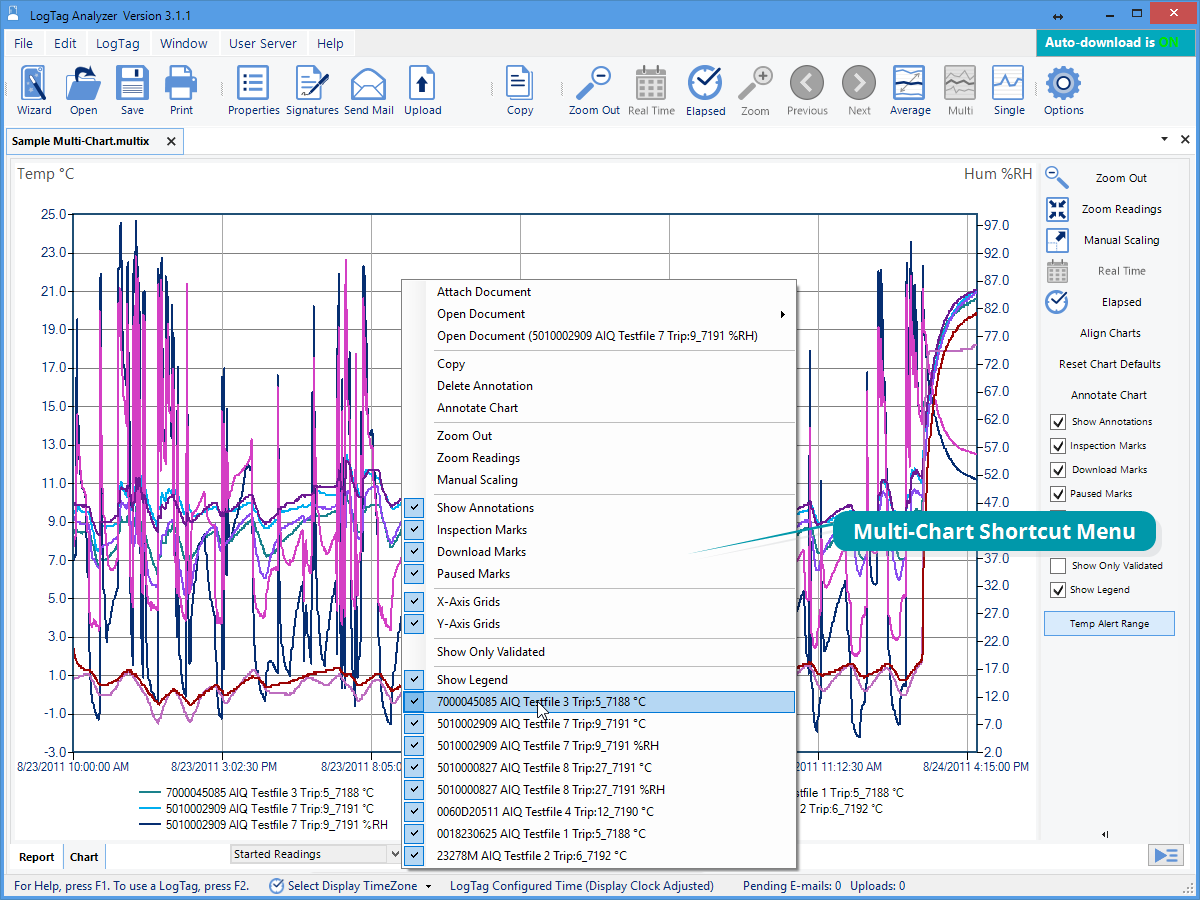
In the Multi-Chart window you can hide each chart individually. Right-click anywhere on the chart, point to the entry of the file you wish to hide and click to clear the tick. To show the chart again, repeat the procedure and select the name again.

Shortcut Menu after right-click on chart area
Opening additional files
If you open additional files, these will initially be shown in separate file window tabs, including data from freshly downloaded LogTag®s. You can add the data for these files to an existing Multi-Chart.
Right-click anywhere on the Multi-Chart and point to Attach Document. Click on the name of the file you wish to add.
Removing files from the Multi-Chart
If you wish to permanently remove a file from the Multi-Chart , hide the chart as described here
Before closing a Multi-Chart with hidden charts, ensure that you have a copy of the files for the hidden charts. Once saved, the hidden files will be permanently removed and cannot be recovered.
More than one Multi-Chart window
If you open at least two additional files, you can generate a second Multi-Chart by clicking the Multi-Chart icon from the toolbar. All files shown in separate windows will be combined into a new Multi-Chart window.The new Multi-Chart window additionally contains all charts from the original Multi-Chart, but they are initially hidden. They can be shown as described here.
Extracting individual files from a Multi-Chart
A Multi-chart contains the complete data sets for each of the loggers from which is was generated.
You can view the data for each individual chart in a single-chart window by extracting them to a *.ltdx file.
Right-click anywhere on the chart, point to Open Document.and click on the file you wish to extract. A new file window tab will open, showing the contents of the extracted file, which is saved in the same location as the Multi-Chart.