The Dashboard
After you have signed in you are greeted with the dashboard. This is your main control center which gives you an overview of recently registered devices, data downloads and allows you to navigate the various pages in LogTag® Online.
Initially, the dashboard is empty:

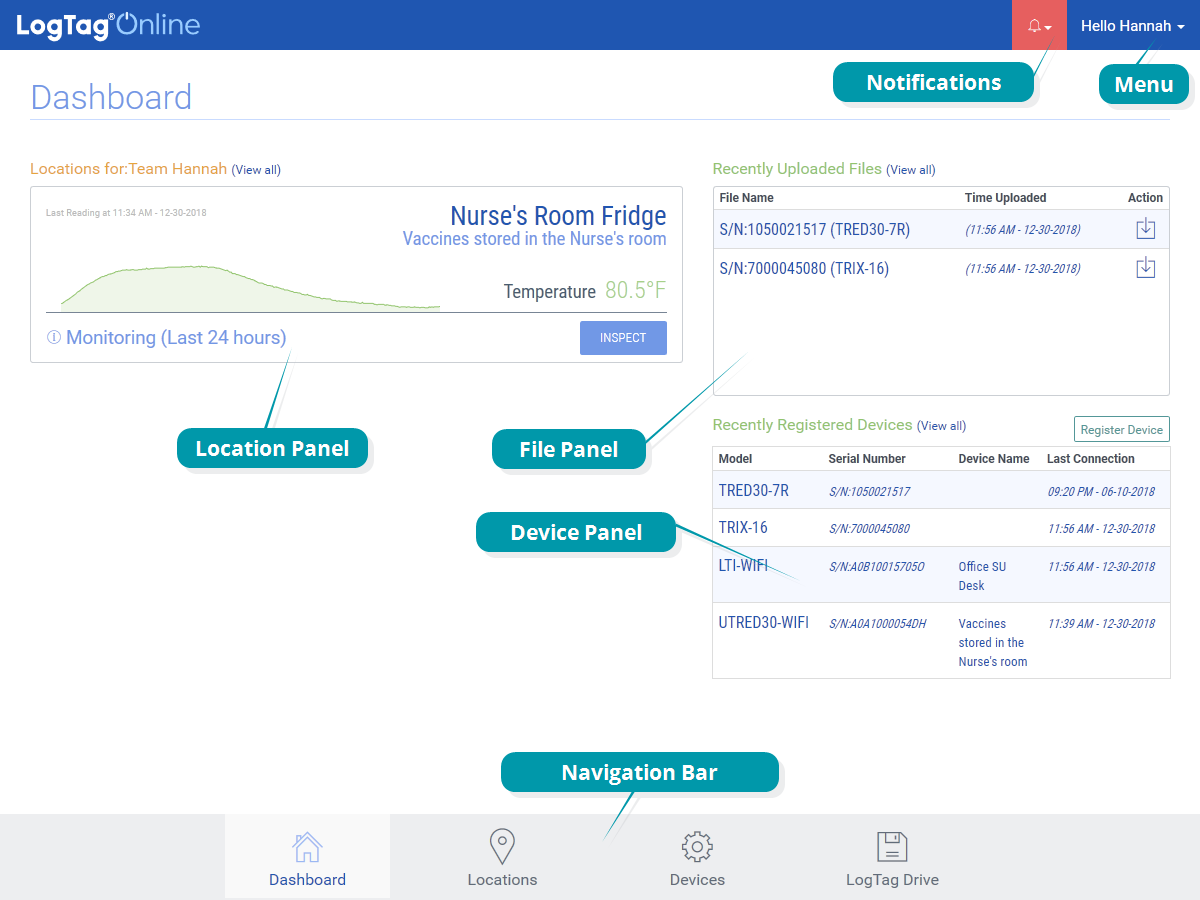
After registering a UTRED30-WIFI and an interface cradle, creating a location and uploading data the dashboard looks like this:
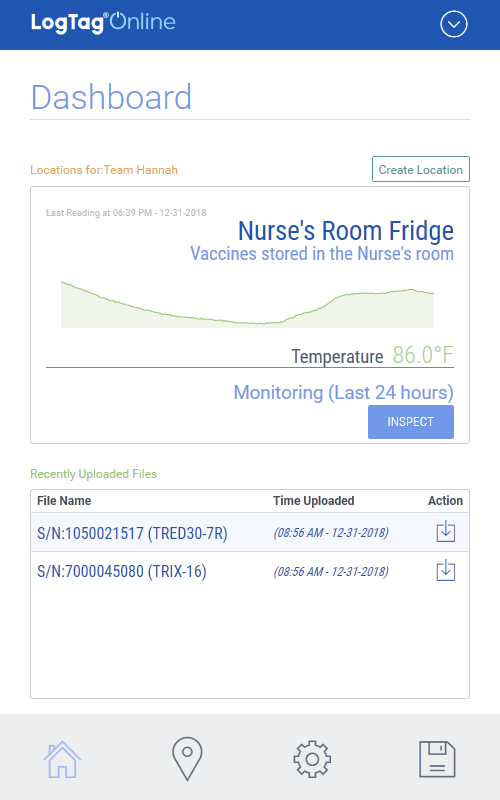
On a mobile device the dashboard will look more compressed, but will still deliver the same information:
Menu
The menu gives you access to your account, the event log and this help. Here, you can also sign out. If you are an owner or administrator of a team you can also edit your team data from here.
Notifications
If you receive a notification, the icon turns red. Click it to review the most recent notifications.
Location Panel
This section of the dashboard will show your monitored locations. More on locations here. Clicking View all will show the Locations page.
File Panel
This section of the dashboard will show your most recently uploaded files. More on uploading files here. Clicking View all will show the LogTag® Drive page.
Device Panel
The 10 most recently registered devices appear in this panel. Clicking View all will show the Devices page.
Navigation Bar
Click any of these four icons for instant access to the main pages of LogTag® Online.
 . You may need to scroll down to see all locations and panels.